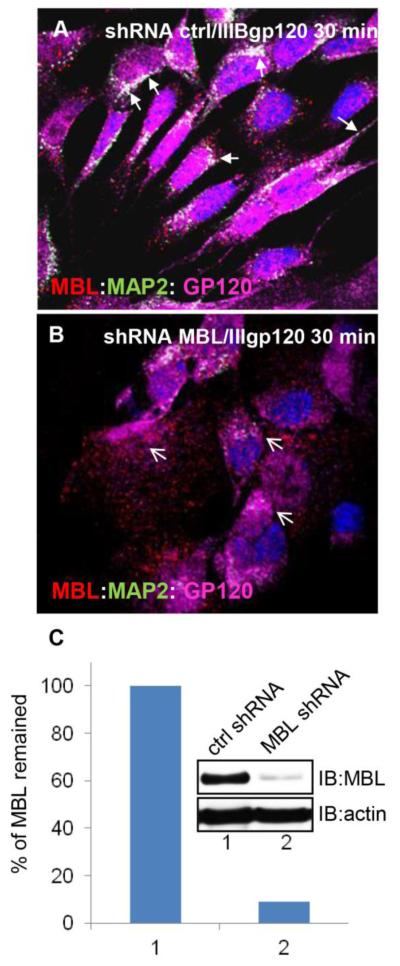
Figure 8. Silencing of MBL expression impaired gp120 trafficking along the neurites.
SKN-SH cells treated with shRNA control (ctrl) (A) or shRNA MBL (B) in the presence of IIIB gp120 for 30min, were fixed and analyzed with laser scanning confocal microscopy. A, Localization and presence of MBL (red):MAP2 (green):gp120 (magenta) complexes in soma and processes of SK-N-SH cells (closed arrows; white indicates co-localization). B, Loss of MBL:MAP2:gp120 complex formation (open arrows). DAPI (blue) stains nuclei. Scale bar, 10 μm. C, Percentage of MBL remained in SK-N-SH cells based on the western blot analyses after MBL2 silencing.

