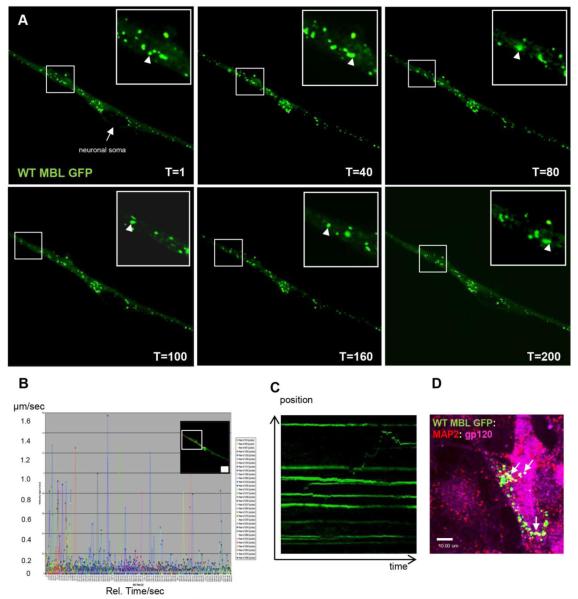
Figure 9. Time lapse live cell imaging shows MBL:gp120 trafficking in subcellular dynamic vesicles.
A, Time lapse microscopy of differentiated SH-SY5Y cells transfected with WT MBLEGFP (green) and treated with 5nM IIIB gp120 for 30min. Time lapse was acquired as one frame every 3 seconds for 10min. Arrowhead indicates anterograde (away from neuronal soma) (T=1 to T=100) and retrograde (towards neuronal soma) vesicle movement (T=100 to T=200). B, Automated vesicle tracking of a specific neurite area indicating vesicle velocities as μm/second on y-axis and relative time (seconds) on x-axis. C, Kymograph analyses of vesicle movement in the specific neurite area indicating anterograde and retrograde movement of a vesicle expressing WT MBL-EGFP and IIIB gp120. D, Co-localization of WT MBL- EGFP (green) with MAP2 (red) and gp120 (magenta) in SH-SY5Y cells (closed arrow; white indicates co-localization). DAPI (blue) stains nuclei. Scale bar, 10 μm.

