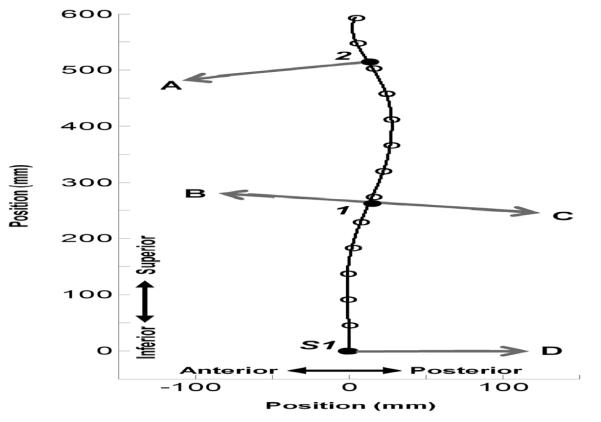
Figure 2.
ShapeTape data points, spline fit, and angle identification.
This plot shows the data points from one participant during extension sitting which has both a lordotic and kyphotic curve. The black open circles represent the X and Y Cartesian coordinates (in mm) for each sensor point. The black curve is the spline fit for this data. The black closed circles are S1, the first inflection point (1), and the second inflection point (2). The gray arrows are vectors of the normal lines at each endpoint pointing into the curve of interest. The angle created between vectors A and B is the kyphotic curvature value and the angle created between vectors C and D is the lordotic curvature value.

