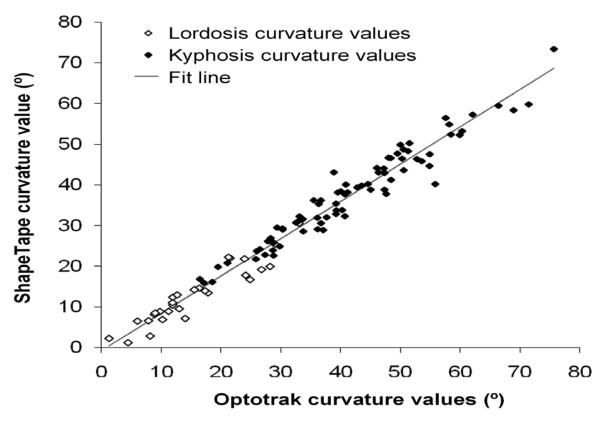
Figure 3.
Correlation of all curvature values.
ShapeTape curvature values plotted against Optotrak for kyphosis and lordosis, when present, from the second trial of all postures (natural, slouch, and extension sitting). The fit line represents results of the generalized estimating equation: ShapeTape = 0.92(Optotrak) – 0.74; R2 = 0.98.

