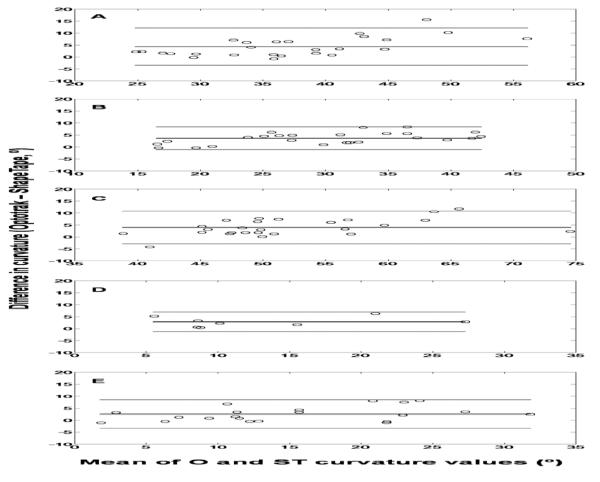
Figure 4.
Bland-Altman plots for kyphotic and lordotic values in all postures.
Data points indicated as black circles, mean difference indicated by solid black line, upper and lower limits of agreement in gray; (A) Kyphosis in natural sitting: mean difference 4.30°, 95% LOA: −3.43-12.04°; (B) Kyphosis in extension sitting: mean difference 3.64°, 95% LOA: −1.07- 8.36°; (C) Kyphosis in slouched sitting: mean difference. 4.02°, 95% LOA: −2.80-10.84°; (D) Lordosis in natural sitting*: mean difference 2.86°, 95% LOA: −1.18-6.90°; and (E) Lordosis* in extension sitting: mean difference 2.55°, 95% LOA: −3.38-8.48°
*Note: sample size for lordosis plots is smaller due to some participants not having a detectable lordotic curve.

