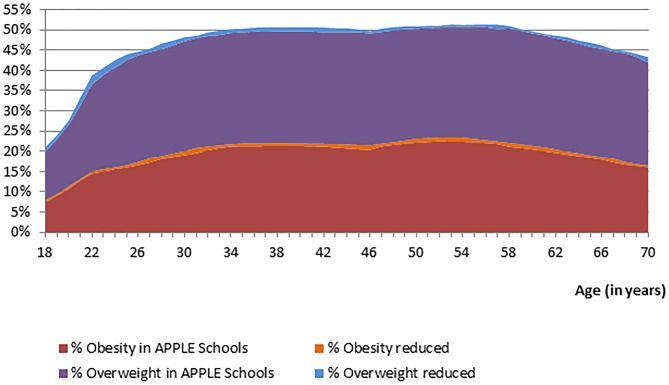
Figure 4. Life course weight status projections for the grade five students attending the APPLE Schools program and those who are not.
Figure 4 footnote: Purple represents the percentage of students attending APPLE Schools who are projected to become overweight; Blue represents the percentage students attending other Alberta schools who are projected to become overweight; Red represents the percentage of students attending APPLE Schools who are projected to become obese; Orange represents the percentage students attending other Alberta schools who are projected to become obese.

