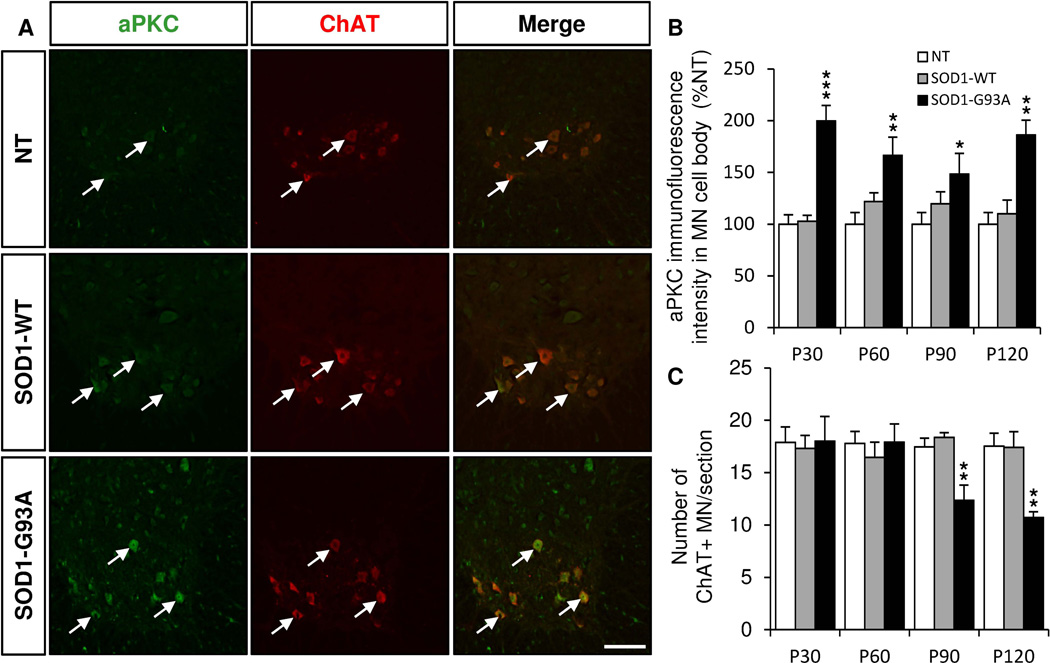
Figure 2. aPKC expression is increased in the motor neurons of the ventral lumbar spinal cord of SOD1 (G93A) mice.
Immunostaining of coronal sections of lumbar spinal cords of non transgenic (NT), SOD1 (WT) and SOD1 (G93A) mice of 30, 60, 90 and 120 days for aPKC (green) and ChAT (red). A, Representative pictures of aPKC/ChAT double immunostaining in P30 NT, SOD1(WT) and SOD1 (G93A) lumbar spinal cords. Arrows indicate motor neurons double labeled for aPKC and ChAT. B, Quantification of aPKC immunoreactivity in ChAT+ motor neurons (MN) in the ventral lumbar spinal cord at different stages of symptom progression. C, Mean number of ChAT+ MN counted per section at different stages. Data represent mean±SEM, n=3–10 animals/group, ** P<0.01, ANOVA with Bonferroni Post-test. Scale bar: 50 µm.

