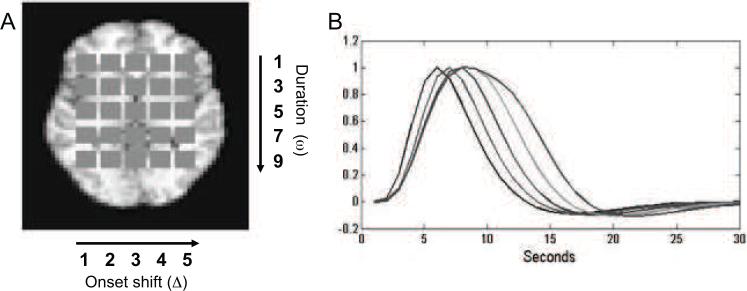
Figure 1.
Overview of simulation set-up (A) A set of 25 equally sized squares were placed within a static brain image to represent regions of interest. BOLD signals were simulated based on different stimulus functions, which varied systematically across the squares in their onset and duration of neuronal activation. From left to right the onset of activation varied between the squares from the first to the fifth TR. From top to bottom, the duration of activation varied from one to nine TR in steps of two. (B) The five HRFs with varying duration. The plot illustrates di erences in time-to-peak and width attributable to changes in duration.

