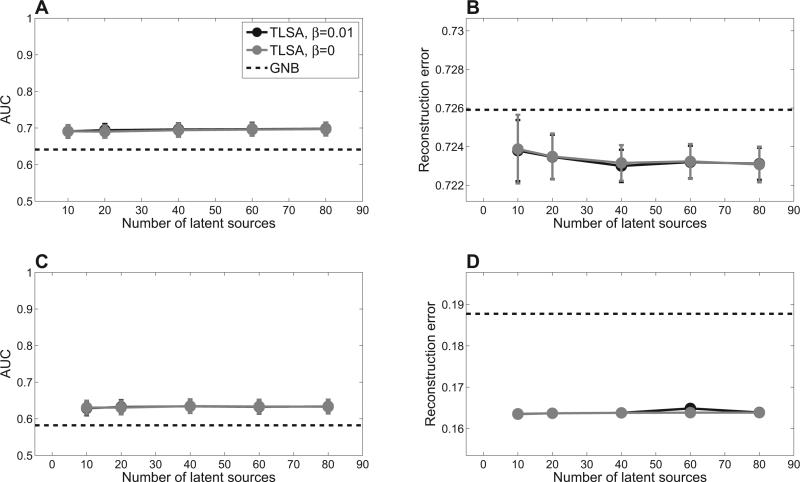
Figure 2. Prediction results.
Top row shows results for the oddball data set; bottom row shows results for the item recognition data set. (A,C ) Mental state decoding accuracy quantified by the area under the receiver operating curve (AUC). Higher values indicate better performance. (B,D) Brain pattern reconstruction performance quantified by mean squared error. Error-bars represent standard error of the difference between TLSA and GNB across subjects.

