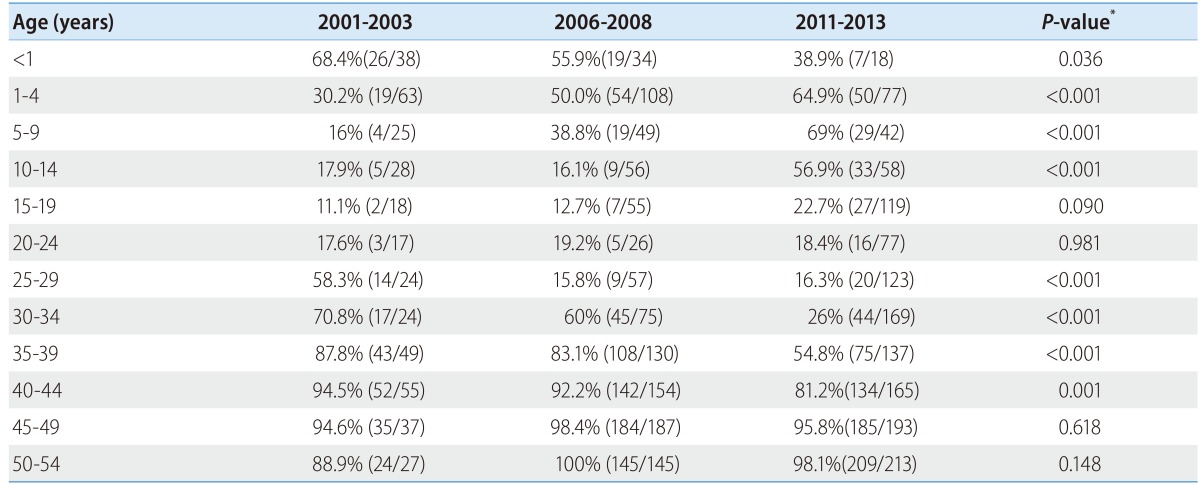
Table 2.
Comparison of IgG anti-HAV prevalence rates between the early 2000s, mid 2000s, and early 2010s according to age group

*Chi-square test for trend.
Comparison of IgG anti-HAV prevalence rates between the early 2000s, mid 2000s, and early 2010s according to age group

*Chi-square test for trend.