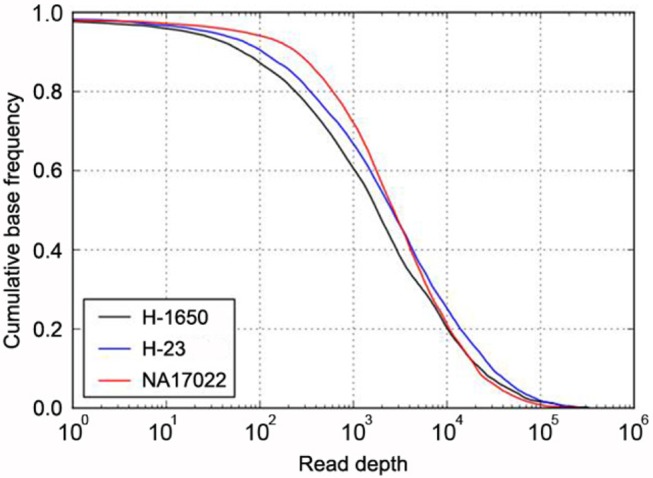
Fig. 1.

Target coverage in cancer and normal samples. The cumulative coverage of targeted bases (i.e., the fraction of all sequenced bases in the target regions that share more than a particular read depth) were plotted after sequencing 4.34 Gb of H-1650 (black), 6.03 Gb of H-23 (blue), and 3.25 Gb of NA17022 (red). The sequencing yield in the three samples resulted in 30× coverage of 92% (H-1650), 95% (H-23), and 97% (NA17022) of all target regions.
