
Table 3.
Mapping statistics of next-generation sequencing experiments
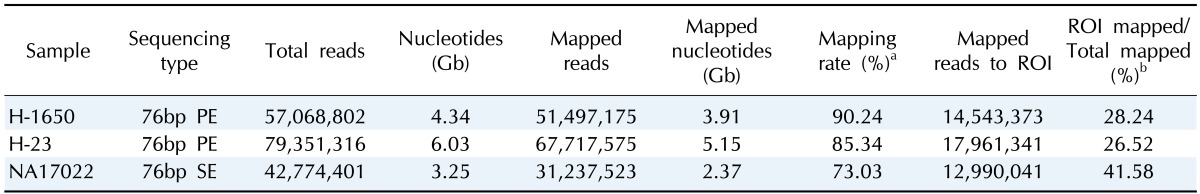
aPercentage of the total number of reads aligned to the human reference genome; bPercentage of the uniquely aligned reads to the region of interest (ROI).
Official websites use .gov
A
.gov website belongs to an official
government organization in the United States.
Secure .gov websites use HTTPS
A lock (
) or https:// means you've safely
connected to the .gov website. Share sensitive
information only on official, secure websites.
Mapping statistics of next-generation sequencing experiments
aPercentage of the total number of reads aligned to the human reference genome; bPercentage of the uniquely aligned reads to the region of interest (ROI).