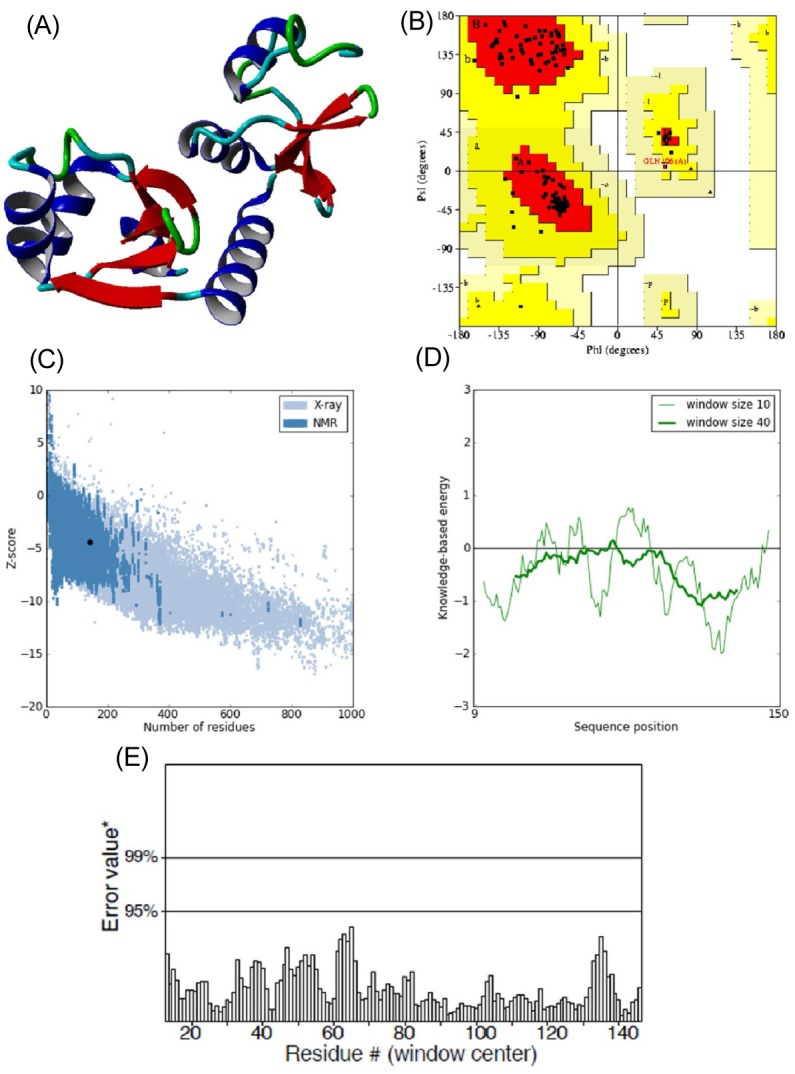
Fig. 2.

(A) 3D structure of predicted human papillomavirus 16 (HPV-16) E6 model. (B) Ramachandran plot of predicted E6 model (the red, dark yellow, and light yellow regions represent the most favored, allowed, and generously allowed regions). (C) ProSA-web Z-scores of all protein chains in PDB determined by X-ray crystallography (light blue) and nuclear magnetic resonance spectroscopy with respect to their length. The Z-score of E6 was present in the range represented in black dot (D) Energy plot for the predicted E6 of HPV-16. (E) ERRAT plot for residue-wise analysis of homology model.
