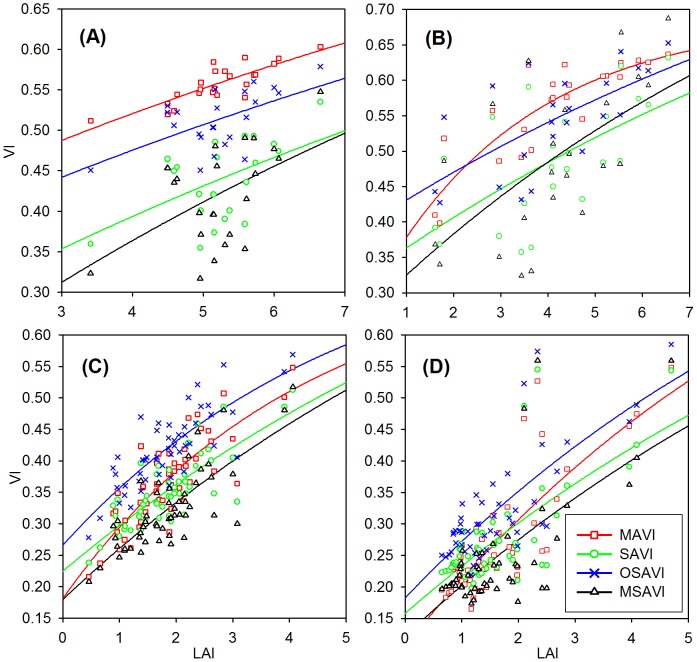
Figure 2. The best fitted relationships between LAI and vegetation indices.
The MAVI and three soil adjusted vegetation indices (SAVI, OSAVI, and MSAVI) are compared in the four study areas: (A) Tiantongshan, (B) Maoershan, (C) Hulunbeier, and (D) Xilinhaote. The statistics of the best fitted VI-LAI relationships are listed in Table 3. MAVI produces a higher R 2, smaller normalized RMSE of retrieved LAI compared with the three soil adjusted vegetation index in both forest and grassland areas.

