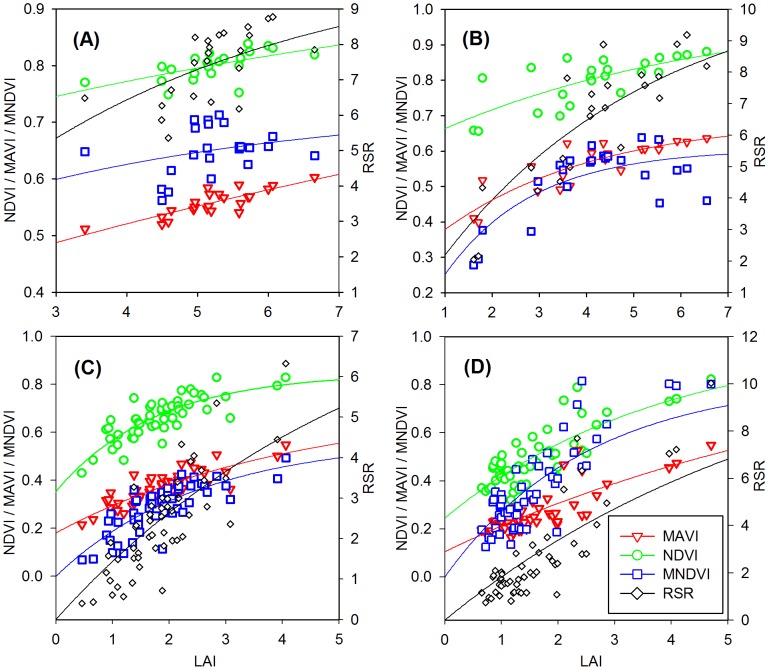
Figure 3. The best fitted relationships between LAI and vegetation indices.
The MAVI and three selected vegetation indices (NDVI, MNDVI, and RSR) are compared in the four study areas: (A) Tiantongshan, (B) Maoershan, (C) Hulunbeier, and (D) Xilinhaote. MAVI produces the largest R 2 and the smallest normalized RMSE of estimated LAI in Tiantongshan and Hulunbeier. The performance of MAVI based on R 2 and RMSE is only slightly second to RSR in Maoershan and Xilinhaote. These results prove that MAVI has stable correlations with LAI under different cover types through incorporating the SWIR reflectance in band-ratio form.

