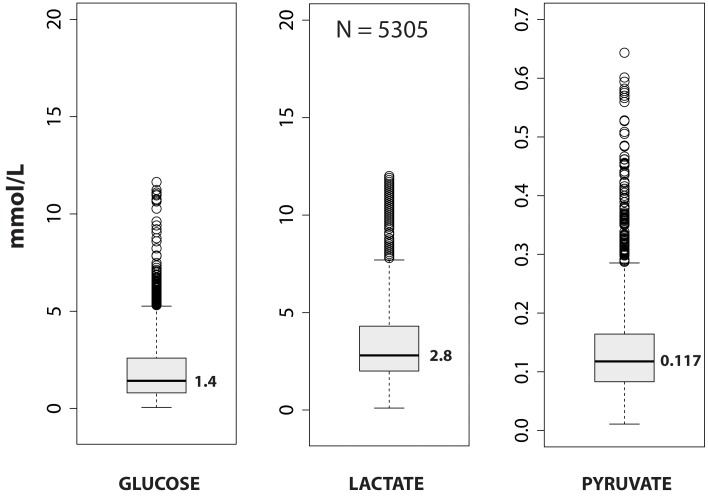
Figure 1. Box-and-whisker plots summarizing the distribution of data for glucose, lactate, and pyruvate.
The rectangular box spans the first to the third quartile of data and the median, marked in the center of the box, is labeled with its value to the right. Whiskers extend to the furthest observations within ±150% of the interquartile range. Observations outside 150% of the interquartile range are marked as outliers with dots. N = 5305 represents all valid matched data for the three variables. All variables were highly skewed to the right. For an explanation, see the text in the results section.

