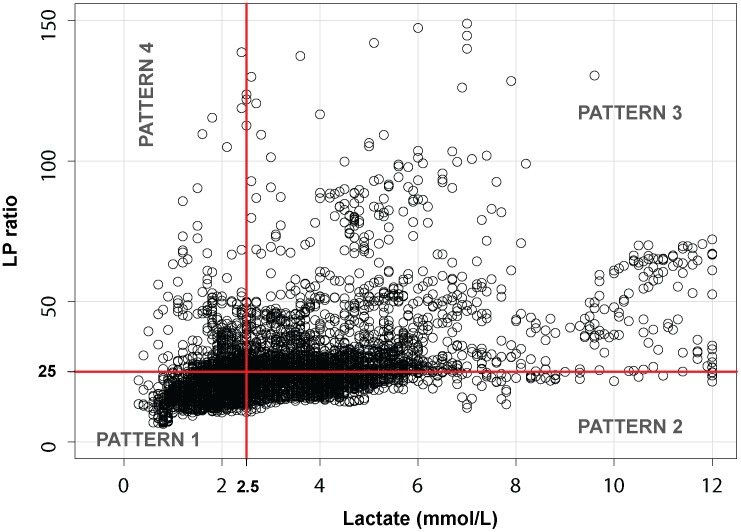
Figure 3. Scatter plot for lactate and the lactate-to-pyruvate ratio.
The entire dataset is divided in the four patterns described in the text. We propose the following terminology for the four patterns: Pattern 1 (normal metabolism), Pattern 2 (aerobic hyperglycolysis), Pattern 3 (anaerobic metabolism), and Pattern 4 (low pyruvate). For an explanation, see the text.

