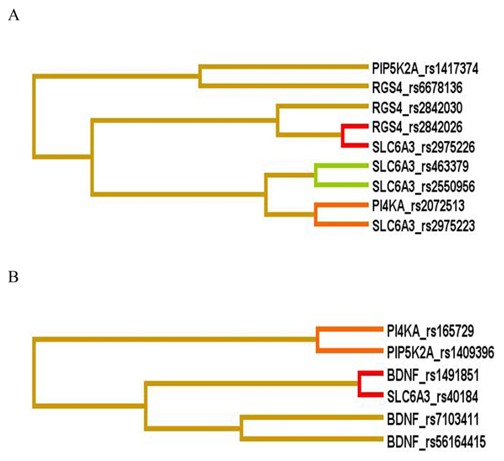
Figure 1. Interaction dendrogram generated from analysis of 53 polymorphisms by MDR method in patients with (A) low severity and (B) high severity of illness.

A red or orange line indicates synergistic relationship; golden line represents additivity and blue or green shows redundancy. Short length arm of dendrogram indicates strong interaction. Footnote: MDR-Multifactor dimensionality reduction.
