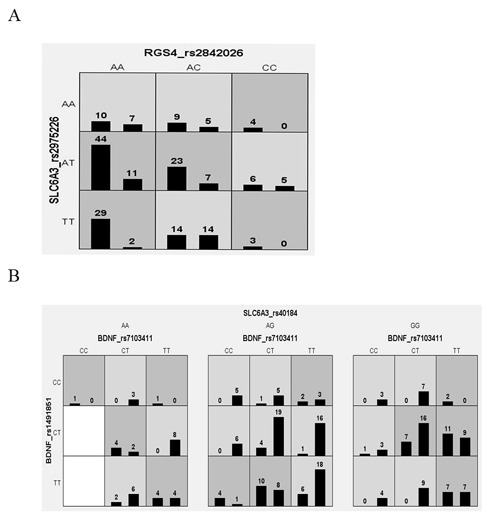
Figure 2. Distribution of high risk (dark shaded) and low risk (light shaded) genotypes of best models among the studied polymorphisms.

Left bars illustrates distribution of complete responders and right bars shows incomplete responders for each genotype combination in (A) low severity and (B) high severity of illness patients with schizophrenia.
