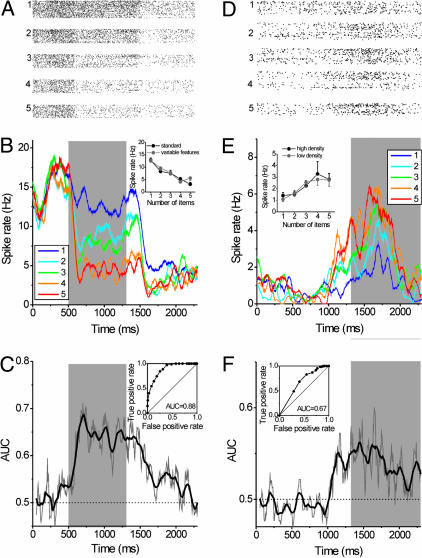
Fig. 3.
Example numerosity-selective neurons from the F-IPS. Neuron 1 (A-C) was selective during sample presentation, neuron 2 (D and E) was selective in the memory delay. For each neuron, the dot-raster histograms for numerosities 1-5 (A and D), the spike-density displays (100-ms boxcar smoothing window; B and E), and the AUC derived from the sliding ROC analysis (C and F) are shown. Insets in B and E display the spike-rate functions (average activity and SE of the mean) to the two stimulus protocols across the sample or delay interval, respectively. Both neurons generalized across changes in stimulus sets. (C and F) The AUC is plotted as function of time for the sliding ROC analysis. The gray line represents the measured AUC values in a 50-ms window slid in 5-ms increments over the trial period. The thick black line was derived by smoothing the original data by adjacent averaging (20 data points smoothing window). (Insets) The ROC curves for the entire sample (C) and delay (F) period.

