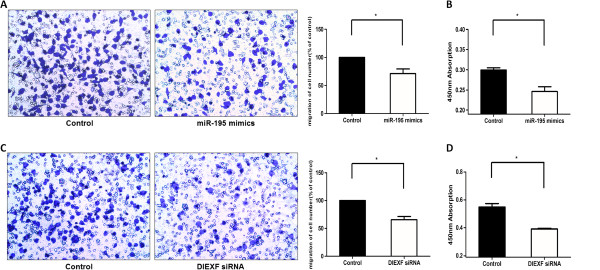
Figure 3.

Function of cytobiology alternation after miR-195 mimics (top) or DIEXF siRNA transfection (bottom) in SH-SY5Y cells. (A), (C): The representative images of invasive cells at the bottom of the membrane stained with crystal violet were visualized as shown (left). The quantifications of cell migration were presented as percentage migrated cell numbers (right). (B), (D): Absorbance at 450 nm was presented with Mean ± SE. * indicates significant difference compared with control group P < 0.05.
