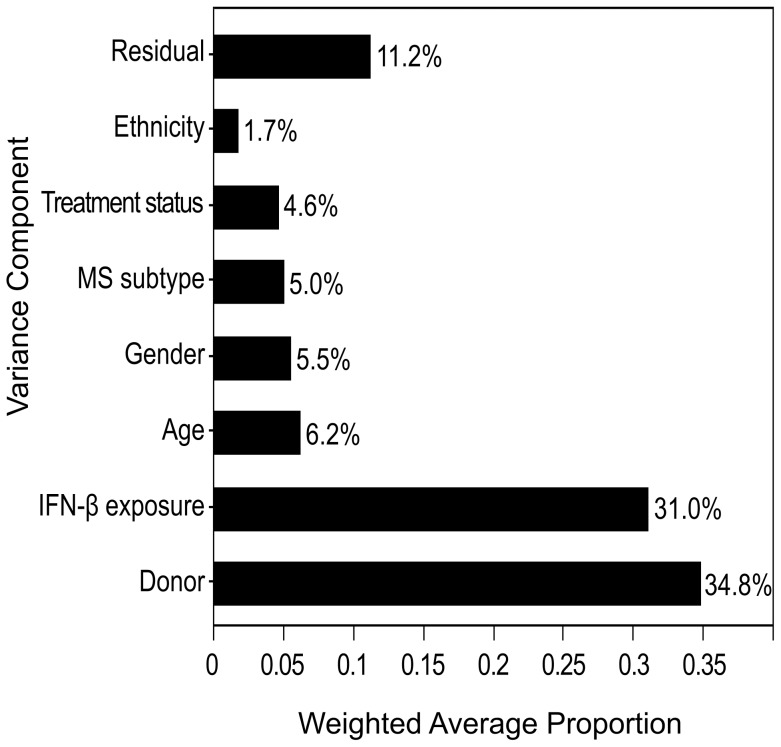
Figure 2. Proportion of variance in gene expression is explained by a major IFN-β response component and donor-specific components.
Variance component analysis was modeled with the following components: Donor - representing variance contributed by unspecified differences between donors; IFN-β exposure (in vitro IFN-β treated LCL sample versus the untreated sample); Age (stratified to under 40 years old or above); Gender; MS subtype (relapsing remitting, relapsing progressive, secondary progressive), Treatment status (IFN-β treatment naïve donors, or donors treated for at least 1 year at the time of sample collection); and Ethnicity (Jewish/Arab). The Residual component models all the variability that cannot be attributed to any of the explicit variance components.

