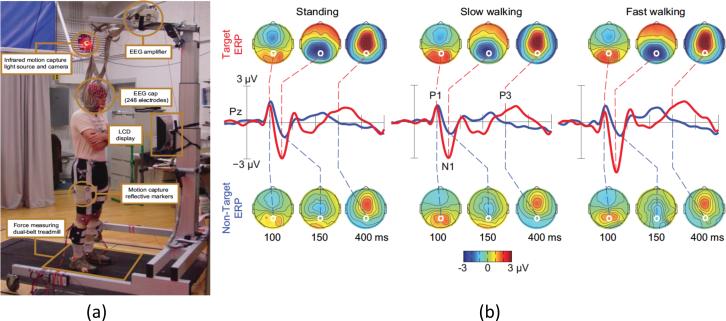
Figure 2.
(a) Mobile brain/body imaging (MoBI) setup for a participant on a treadmill and performing a visual oddball response task during standing, slow walking and fast walking. (b) Grand-average event-related potentials (ERPs) during standing, slow and fast walking. The ERP time course is represented in red for the target and blue for the non-target. Scalp maps show the grand-average ERP scalp distributions at 100, 150 and 400 ms after onsets of target (upper row) and non-target (lower row) stimuli. White dots indicate the location of electrode Pz. Note the scalp map similarities across conditions. Adapted from [97].

