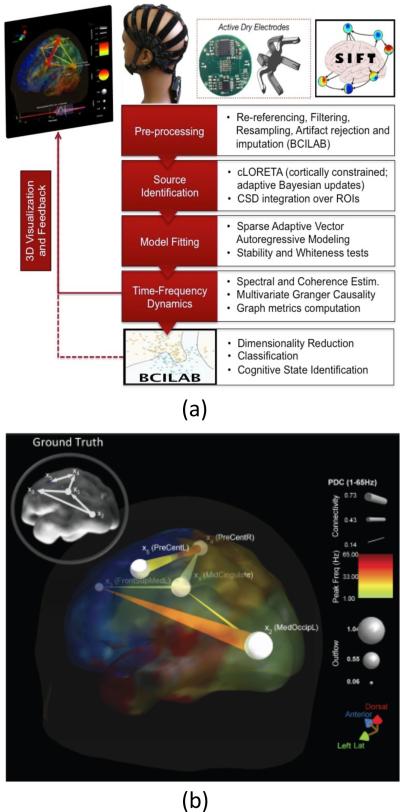
Figure 5.
3D visualization of brain activity in real-time with a wireless EEG headset. (a) Real-time data processing pipeline using a Cognionics 64-channel system with flexible active dry electrodes, and the open source EEGLAB [64] extensions SIFT [65] and BCILAB [67]. (b) Temporal snapshot of online reconstructed source networks with Partial Direct Coherence (PDC estimator) displayed with the BrainMovie3D visualizer for simulated data. Node size indicates outflow (net influence of a source on all other sources). Cortical surface are colored according to their AAL atlas label (90 regions). Adapted from [113].

