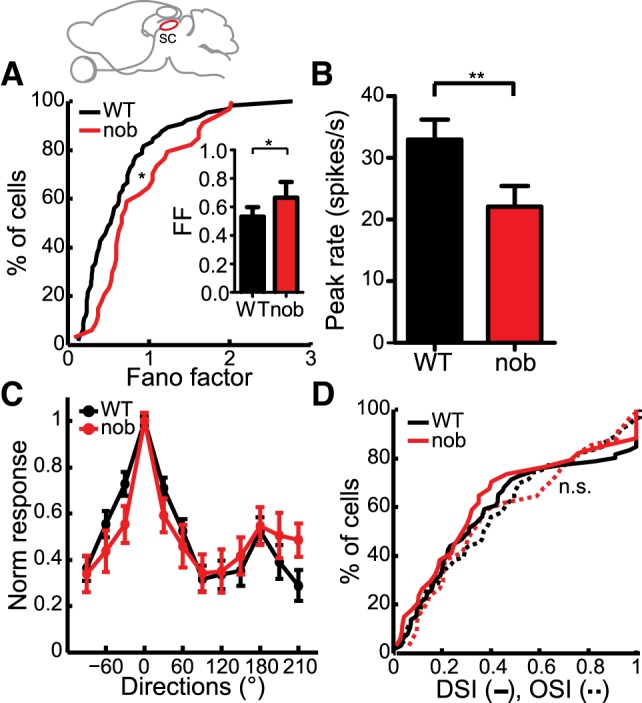
Fig. 6.

Increased variability in nob SC. A: cumulative distributions of Fano factor in WT and nob SC (WT, n = 66, nob, n = 34 cells). Inset: comparison of the medians. B: decreased peak firing rates in the SC of nob mice. C: normalized tuning curves of responses to various directions are similar in WT and nob mice. D: cumulative plots show no difference in the DSI (solid lines) and OSI (dashed lines) in nob mice. All bars indicate means + SE. **P < 0.01.
