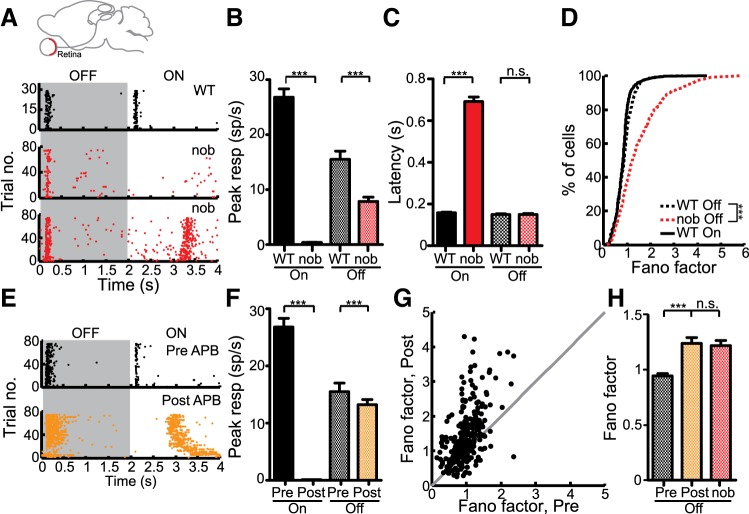
Fig. 7.
Retinal origin of increased response variability. A: raster plots of responses to full field flashes of retinal ganglion cells (RGCs) in WT (top) and nob (middle and bottom). In some nob RGCs (bottom) a delayed On response was observed. B: peak firing rates calculated within the first 500 ms following flash onset/offset using a sliding window (100 ms) (Off: WT, n = 591, nob, n = 474; On: WT, n = 709, nob, n = 336 cells). C: latency of the peak response shows a greater delay in the On responses of nob mice. D: distribution of Fano factors at the peak response shows greater values in nob mice. E: example raster plot of a WT RGC before (top) and after treatment with dl-2-amino-4-phosphonobutyric acid (2-APB; bottom). F: decreased On response after 2-APB treatment (Off: n = 576; On: n = 343 cells). G: comparison of the Fano factor before and after 2-APB. Gray line indicates the unity line. H: increase in Fano factor in the Off response after removal of On pathway. All bars indicate means + SE. ***P < 0.001.

