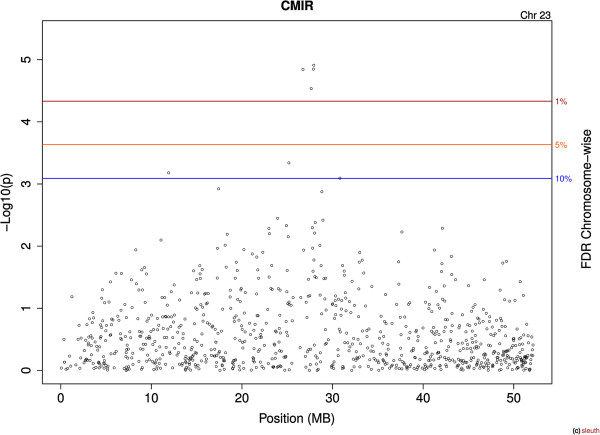
Figure 4.

Manhattan plot for the cell-mediated immune response (CMIR) SNPs on chromosome 23 of Holstein cattle. The x-axis is the position of each SNP on the bovine chromosome and the y-axis is the –log10 P. The lines indicate chromosome-wise false discovery rate (FDR).
