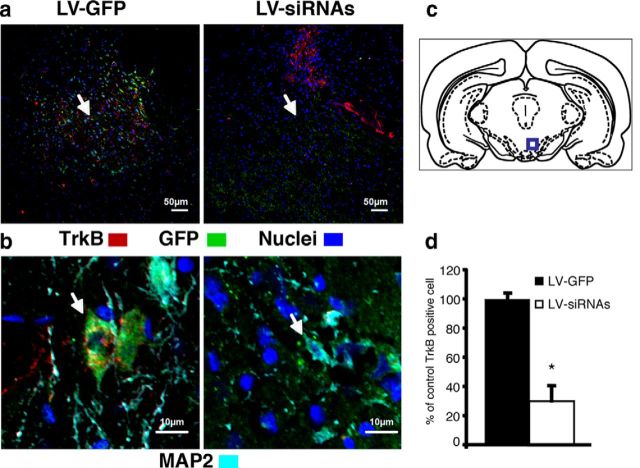
Figure 1.
Photomicrographs of rat coronal sections identifying lentiviral infections in the VTA. a, Double-labeled cell with GFP (green) and TrkB (red). Nuclei are in blue, in GFP lentiviral vector pTK433 (LV-GFP)-infected animals (left) and siRNAs expressing lentiviral-infected (LV-siRNAs) and LV-GFP animals (right). Yellow denotes the overlapping of LV-GFP and TrkB labeling, which is very prominent is control animals (LV-GFP) and almost absent in LV-siRNAs-infected animals (arrow). b, Identification of LV-GFP (left) and LV-siRNAs (right) infections in VTA neurons labeled with the neuronal marker MAP2 (cyan). An overall decrease in sizes of VTA LV-siRNAs-positive neurons with respect to the VTA LV-GFP control can be observed (compare arrowed neurons on the left and right). c, A schematic of the anatomical region from which the section displayed in a and b was taken. d, Inhibition of TrkB expression in the VTA mediated by LV-siRNAs (n = 6) as opposed to control LV-GFP (n = 6; *p < 0.05). Data are numbers of TrkB-positive cells, expressed as a percentage of the LV-GFP control ± SEM.

