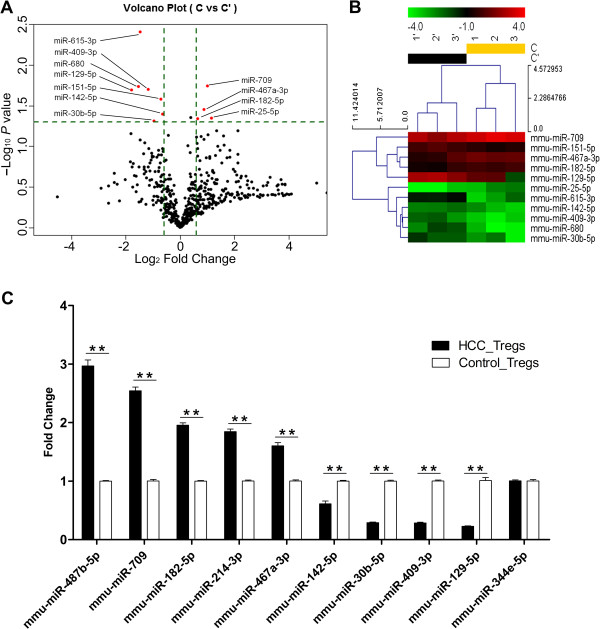
Figure 1.

miRNAs differentially expressed in HCC-activated Tregs. (A) Differentially expressed miRNAs identified in the microarray. Eleven miRNAs (red plots) passed the volcano plot filtering. (B) Unsupervised hierarchical clustering of differentially expressed miRNAs. Scale bar: up-regulated (red), down-regulated (green). Log2 transformed data were used. C: HCC-activated Tregs (three replicates: 1, 2, 3); C’: control Tregs (three replicates: 1’, 2’, 3’). (C) Validation of the differentially expressed miRNAs by qRT-PCR. Values were presented as mean ± SEM from three independent experiments performed in triplicates and were analyzed using the two-tailed Mann–Whitney test. **P < 0.01 for indicated comparison.
