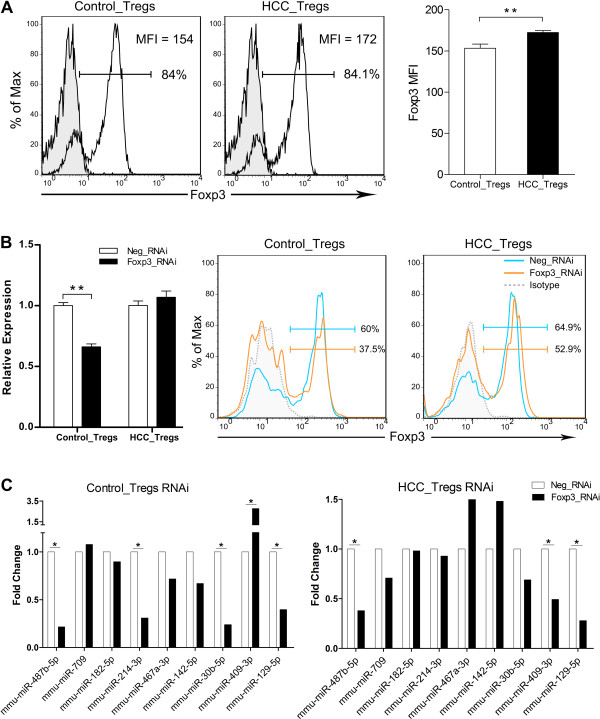
Figure 2.

Special modulation of the miRNAs by Foxp3. (A) Representative FACS plots of Foxp3 were shown in control Tregs and HCC-activated Tregs (left). Mean fluorescence intensity (MFI) was included in each of the panels. Summary of the Foxp3 MFI was presented (right) in control Tregs and HCC-activated Tregs. (B) Tregs were transfected with Foxp3-specific siRNAs or negative controls and forty-eight hours later cells were harvested. Expression levels of Foxp3 were determined by qRT-PCR (left) and representative FACS plots were shown in control Tregs and HCC-activated Tregs (right). Results in (A) and (B) were presented as mean ± SEM of three independent experiments performed in triplicates and analyzed by the two-tailed Student’s t-test. **P < 0.01 for indicated comparison. (C) Expression patterns of the nine miRNAs after Foxp3 silencing in control Tregs (left) and HCC-activated Tregs (right). The expression levels of each miRNAs after Foxp3 silencing were shown as fold change relative to the negative control siRNAs. Data were from one microarray. * fold change > 1.5 for indicated comparison. Control_Tregs: Tregs from control mice; HCC_Tregs: Tregs from mice bearing Hepa 1–6; Neg_RNAi: Tregs transfected with negative control siRNAs; Foxp3_RNAi: Tregs transfected with siRNAs against Foxp3.
