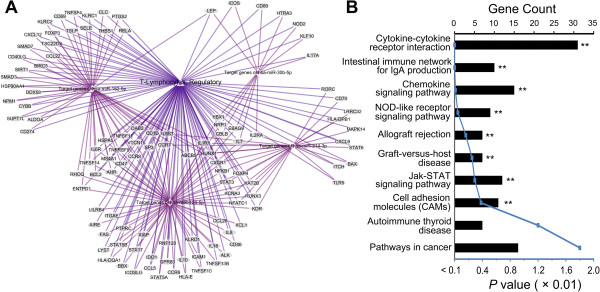
Figure 4.

Bioinformatic analysis of target genes of the four miRNAs. (A) The network of target genes of the four miRNAs involved in Tregs functions. Each ellipse represented a target gene predicted by TargetScan. The four rhombuses were miRNAs and the triangle was the MeSH term of Tregs. Purple lines indicated genes involved in Tregs according to MeSH database; magenta lines outlined the miRNAs-target genes relations. (B) Pathway enrichment of target genes. The y-axis represented pathways enriched based on predicted target genes of the four miRNAs. The histogram indicated gene number in each pathway (upper black x-axis); the curve line indicated the P value (lower blue x-axis). **P < 0.01 with the Bonferroni correction.
