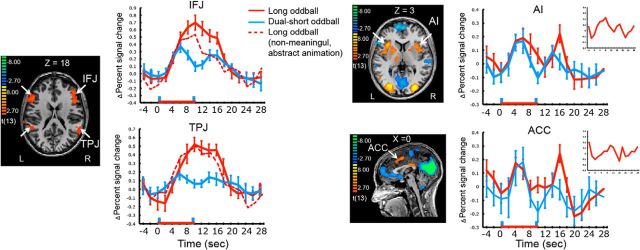
Figure 2.
SPMs showing IFJ, TPJ, AI, and ACC. The first and second blue vertical bars (at time point zero and nine) in the time courses indicate the first and second short (1 s) oddballs in the dual-short oddball condition. The red stippled lines are activation time course of the IFJ and TPJ when the oddballs consisted of only nonmeaningful, abstract movies. The insets in the AI and ACC time course plots show the activation profiles of these ROIs when defined by contrasting the single-short and dual-short oddball trials with the search trials. The red horizontal line indicates the presentation of 10 s long oddballs. Error bars represent SEM.

