
Figure 6.
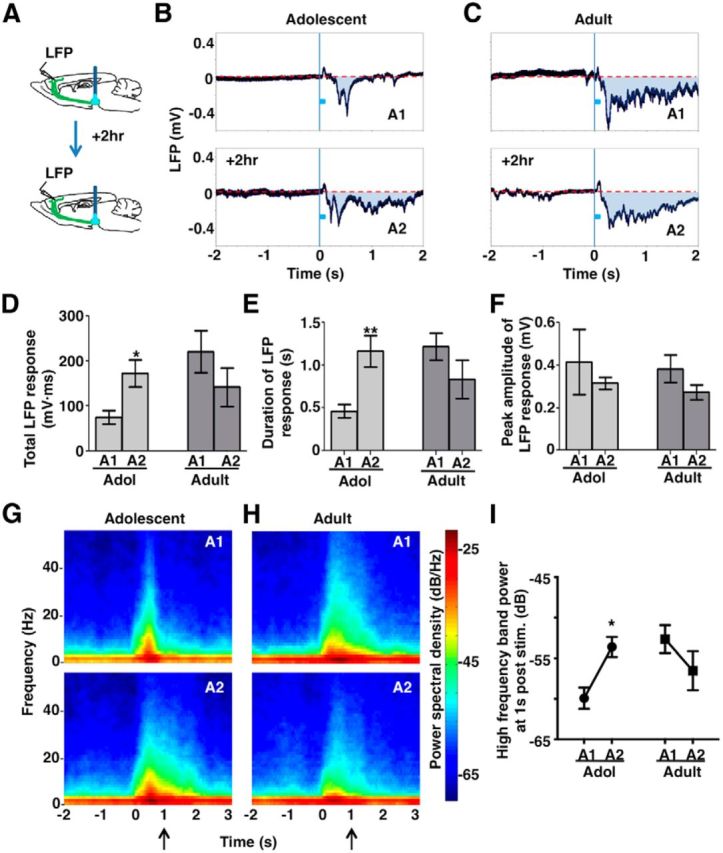
Phasic activation leads to elevated mesofrontal circuit activity in adolescence. A, Experimental conditions. B, C, Frontal cortical LFPs evoked by phasic VTA activation in an adolescent (B) and adult (C) mouse. The blue boxes indicate phasic stimuli (50 Hz pulses for 200 ms). The shaded areas (A1, A2) indicate total LFP responses induced by VTA stimulation. Each trace is averaged from 10 sweeps of recordings. D, Total LFP responses in session 1 (A1) and 2 (A2) in adolescent (∼4–5 weeks) and adult (∼2–4 months) mice. Two-way RM-ANOVA, age-by-session interaction, F(1,14) = 13.82, p = 0.002; Bonferroni's posttest, adolescent (Adol) A1 versus A2, *p = 0.023. E, Duration of LFP responses in session 1 (A1) and 2 (A2) in adolescent and adult mice. RM-ANOVA, age-by-session interaction, F(1,14) = 19.4, p = 0.0006. Bonferroni's posttest, Adol A1 versus A2, **p = 0.003. F, Peak amplitude of LFP responses in session 1 (A1) and 2 (A2) in adolescent and adult mice. No significant difference was observed in adolescent or adult mice. RM-ANOVA: age, F(1,14) = 0.146, p = 0.708; session, F(1,14) = 1.983, p = 0.181; interaction, F(1,14) = 0.004, p = 0.948. G, H, Spectrogram of the LFP signals in a period from 2 s before VTA stimulation to 3 s after in adolescent (G) and adult (H) mice. Spectral analyses were conducted for each 0.5 s sliding window (0.1 s step) in individual sweeps of LFP recordings. The graphs show the average of all the animals in each condition. I, To summarize the long-lasting changes in high-frequency oscillations, the power spectral density calculated at 1 s post VTA stimulation (arrows in G and H) was averaged over a high-frequency band (4–55 Hz, θ to γ oscillation range) for each subject and condition. RM-ANOVA, age-by-session interaction, F(1,14) = 11.83, p = 0.004; Bonferroni's posttest, Adol A1 versus A2, *p = 0.019. n = 8 mice for each group. Data are means ± SE.