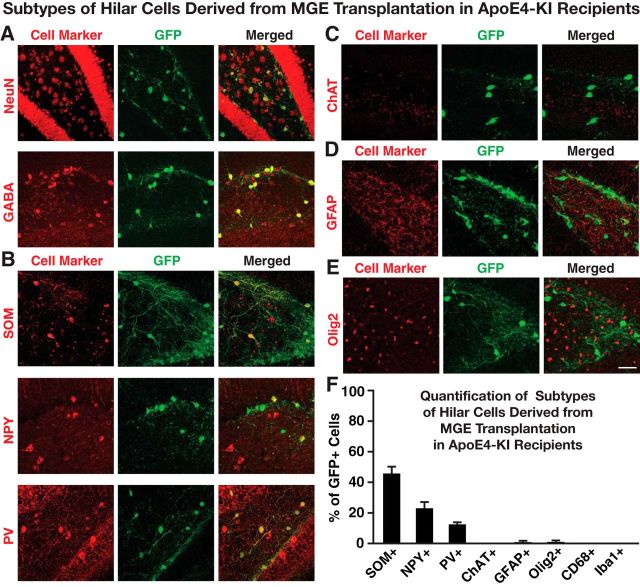
Figure 3.
Immunofluorescent analyses of neuronal subtypes derived from transplanted MGE cells in the hippocampal hilus of apoE4-KI mice at 80–90 DAT. A, Transplanted MGE cells were stained positive for NeuN and GABA. B, Immunofluorescent costaining of inhibitory interneuron subtypes positive for SOM, NPY, and PV. C–E, Immunostaining of cells that were positive for ChAT (C), GFAP (D), or Olig2 (E). F, Quantification of the percentage of GFP+ cells that were also positive for different cell markers (n = 5–8 sections per brain, 3–5 mice per group for each cell marker). Values are shown as the mean ± SEM. Scale bar, 50 μm.

