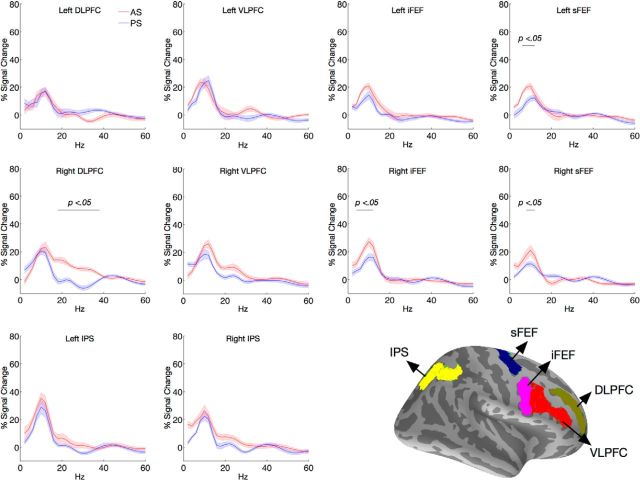
Figure 2.
Averaged spectral power during the preparatory period for all ROIs. The black horizontal bar indicates the spectral cluster that showed significant task modulation in spectral power. Bottom right depicts the anatomical masks used to define the ROIs. Note that for each participant, ROIs were created in their respective native surface space, thus the exact dipole location used for ROI definition varied across individuals. Shaded areas indicate 1 SE.

