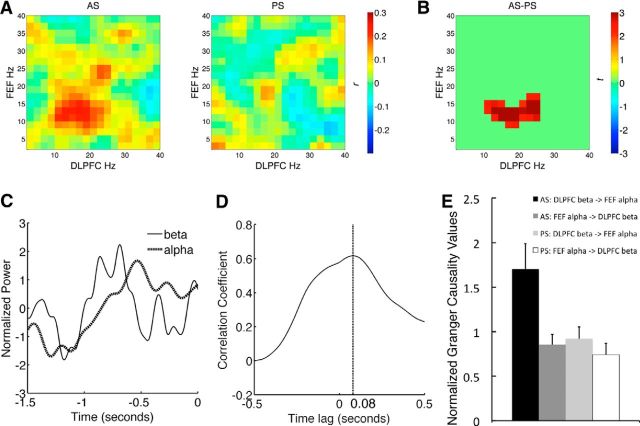
Figure 6.
Functional coupling between DLPFC beta-band activity and FEF alpha-band activity. A, Cross frequency amplitude coupling matrices between the DLPFC and the FEF. Color bar indicates the strength of functional connectivity (correlation coefficient, r). B, Spectral cluster that showed significantly stronger beta-alpha amplitude coupling between the DLPFC and the FEF for the AS task, when compared with the PS task. Color bar indicates the test statistic (t). C, The timing of power amplitude time courses. Time courses were normalized by converting to z-scores to equate the mean amplitude and variance. D, Lagged correlations between DLPFC beta-band amplitude and EFF alpha-band amplitude. The x-axis indicates the time lag of DLPFC beta-band activity leading FEF alpha-band activity. Maximum correlation was found when DLPFC led FEF by 80 ms (the dashed vertical line). E, Granger causality values between DLPFC beta-band activity and FEF alpha-band activity. Error bar indicates 1 SE.

