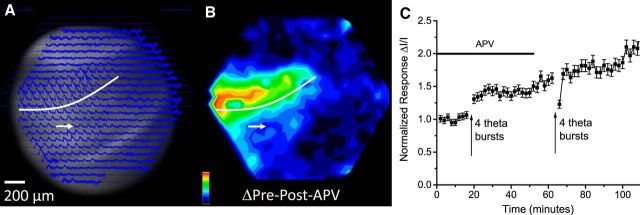
Figure 7.
NMDA receptor dependence of potentiation in the CA3 region in coronal slices with stratum lucidum stimulation. A, A CCD image of the CA3 region with optical traces overlain (stimulation 50 μA, 0.2 ms). B, Potentiation map in the presence of 50 μm APV, normalized to the maximum. The white arrow marks the site of stimulation and the white curve marks the CA3 pyramidal cell layer. C, Time course from sites showing maximal potentiation in the CA3 region with TBS at the arrows (ΔI/I; mean ± SEM; N = 4). The horizontal line indicates APV application.

