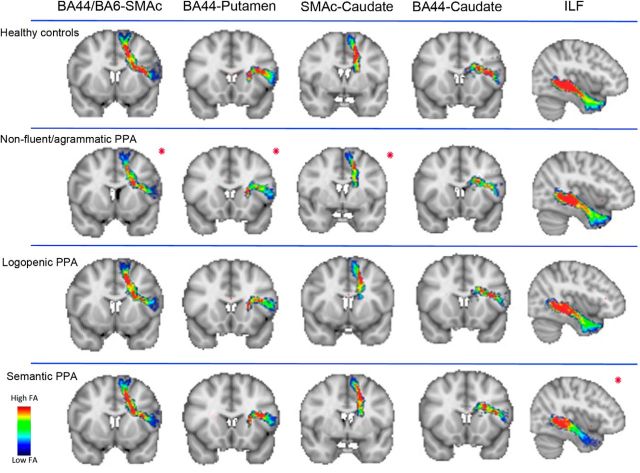
Figure 7.
Distribution of fractional anisotropy along the tracts of the speech production network and the ILF. Shown are group averages of the distribution of FA along the speech production tracts statistical significant in the nfvPPA group after multiple comparisons (red asterisk). We also reported a tract of the network (BA44-Caudate) not significant after multiple comparisons for FA but significant in all of the other metrics and the ILF as control tract in nfvPPA. In the scale bar, red indicates regions of the tract with high FA values and blue indicates low FA values. The significance of FA in the ILF was found in svPPA, mainly in its anterior portion.

