
Figure 4.
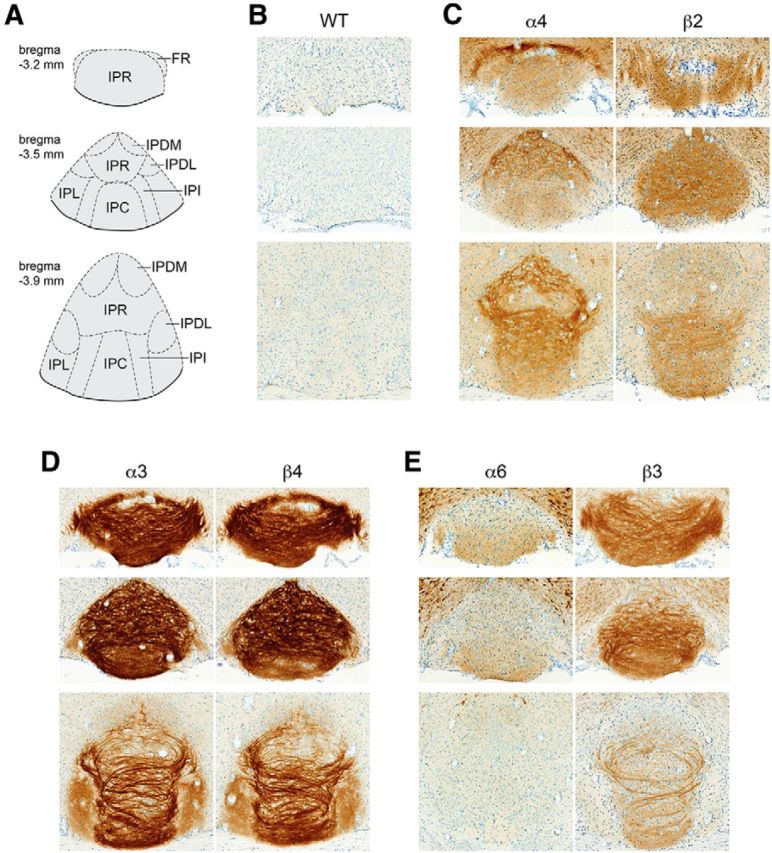
Localization of GFP-fused nAChR subunits in IPN. A, Brain atlas diagram for 3 bregma coordinates (bregma −3.2 mm, −3.5 mm, and −3.9 mm) corresponding to anterior, medial, and posterior interpeduncular nucleus. B–E, Brains from six mouse strains expressing GFP-fused nAChR subunits were fixed, sectioned at 35 μm, and immunostained with anti-GFP antibodies. B, C57BL/6 WT brains were processed as a staining negative control. A representative (of n = 3) image of an IPN coronal section is shown for each nAChR-GFP mouse strain at the indicated anterior/posterior coordinate. α4 and β2 (C), α3 and β4 (D), and α6 and β3 (E) were grouped together based on coexpression in MHb and/or other brain areas.