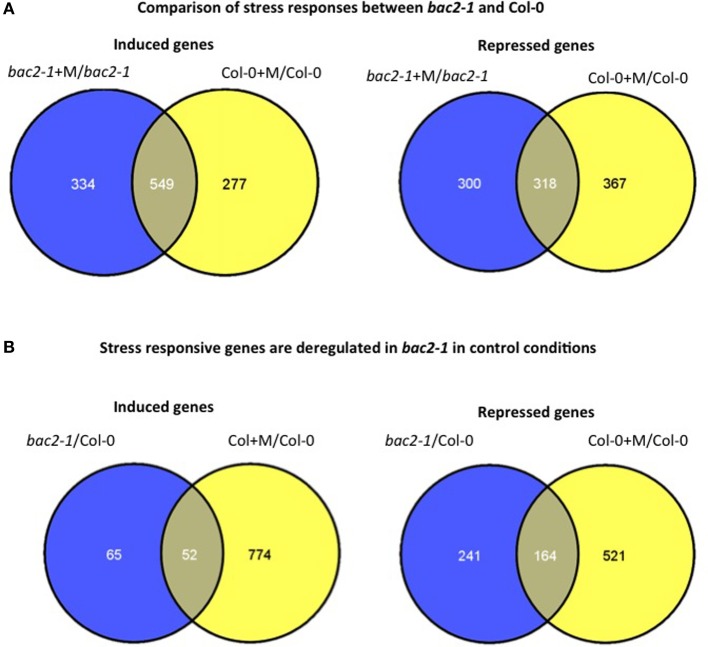
Figure 5.
Comparison of gene expression in bac2-1 and Col-0 plantlets. (A) Venn diagram of differentially expressed genes in bac2-1 and Col-0 after water stress (+M) including induced genes or repressed genes. (B) Venn diagram of differentially expressed genes in bac2-1 without stress and Col-0 after stress (+M) including induced genes or repressed genes. Venn diagrams were generated according to transcriptome data from Geosite GSE15063 and online software http://bioinfogp.cnb.csic.es/tools/venny/index.html.

