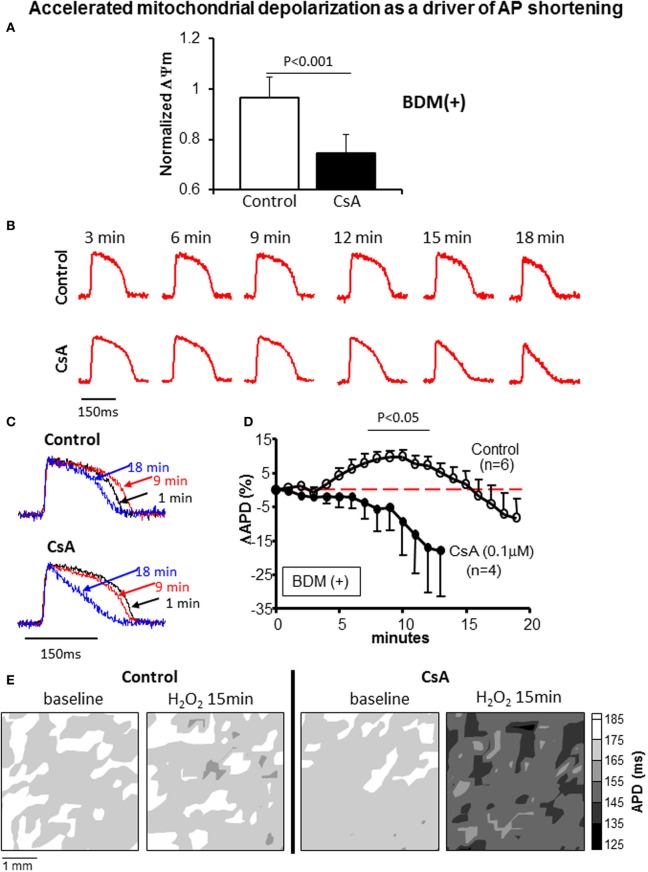
Figure 7.
(A) ΔΨm at 15 min of OS normalized to baseline value in control and CsA treated hearts. (B,C) Representative action potentials recorded during early challenge with acute OS in control and CsA treated hearts. AP shortening is more pronounced in CsA compared to control hearts, indicating heightened sensitivity to OS. (D) OS-induced % change in APD relative to baseline (pre-H2O2 value) in control and CsA treated hearts. (E) Representative APD contour maps showing global shortening of APD in response to OS in CsA treated hearts compared to controls.

