Figure 2.
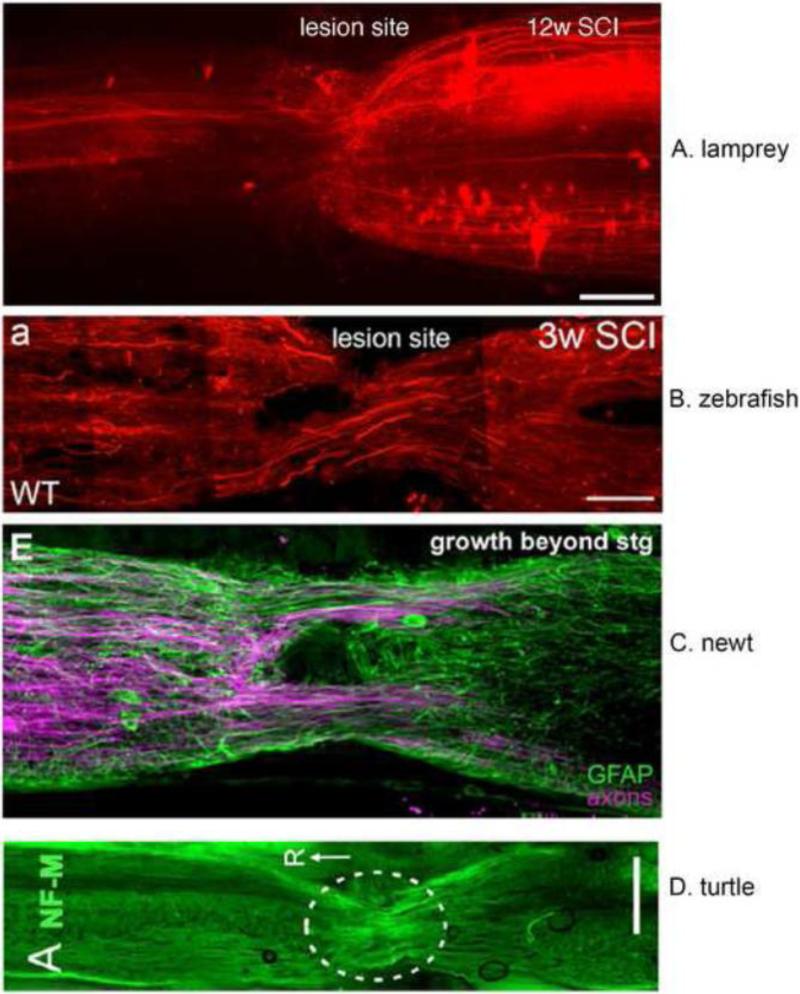
Robust axonal regeneration after spinal cord injury occurs in multiple non-mammalian model organisms.
(A) Retrograde tracing with DTMR (red) was performed on lampreys twelve weeks after complete spinal cord transection, when behavioral recovery is maximal. DTMR was applied 1cm caudal to the original transection site. Arrowheads indicate three regenerated axons. Since this is a complete transection injury model, any axons crossing the original lesion site have regenerated. Scale bar: 200μM. Image provided by Angelos Papatheodorou and Ona Bloom.
(B) Retrograde axonal tracing was performed on adult zebrafish three weeks after complete spinal cord transection, when swimming ability is almost normal. Experimental details and original image from: Figure 6A, Goldshmit, Sztal, Jusuf, Hall, Nguyen-Chi, Currie PD. Journal of Neuroscience, May 30, 2012, 32(22):7477-7492.
(C) Axonal tracing and anti-GFAP antibody labeling was performed on adult newt after complete spinal cord transection. Experimental details and original image from: Figure 6E, Zukor K, Kent D, Odelberg S. Neural Development, January 4 2011, 6:1-22.
(D) Regenerating axons visualized by neurofilament M antibody labeling in a turtle after complete spinal cord transection. Experimental details and original image from: Figure 10A, Rehermann M, Marichal N, Russo R, Trujillo-Cenoz O. The Journal of Comparative Neurology March 20, 2009, 515: 197-214.

