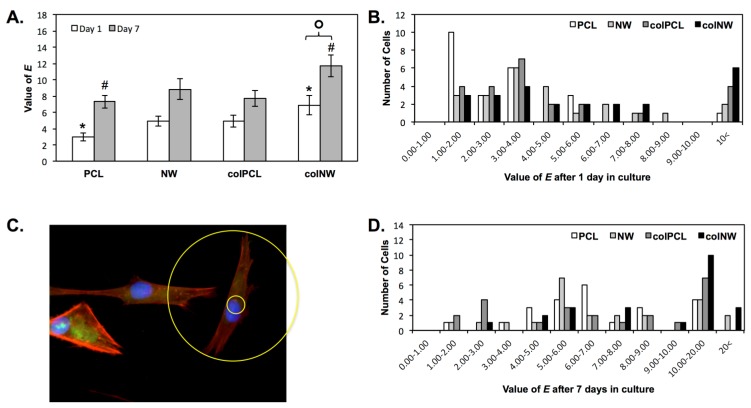
Figure 6.
(A) Elongation (E) approximations of cells on different surfaces after one and seven days of culture. Experiments were replicated on at least three different samples with at least three different cell populations (nmin = 9). Statistical significance was calculated using a one-way ANOVA with Tukey’s post hoc test. Results indicate that colNW surfaces exhibit a more elongated morphology after one and seven days of culture compared to PCL surfaces at the same time points (*, #, p < 0.05). SMCs also become significantly more elongated on colNW surfaces after seven days of culture compared to those in culture for one day on colNW surfaces (¢, p < 0.05). Error bars represent the standard error; (B) The image shows how E approximations were calculated (outer diameter/inner diameter); A histogram of E approximations of cells on different surfaces after (C) one day in culture and (D) seven days in culture.

