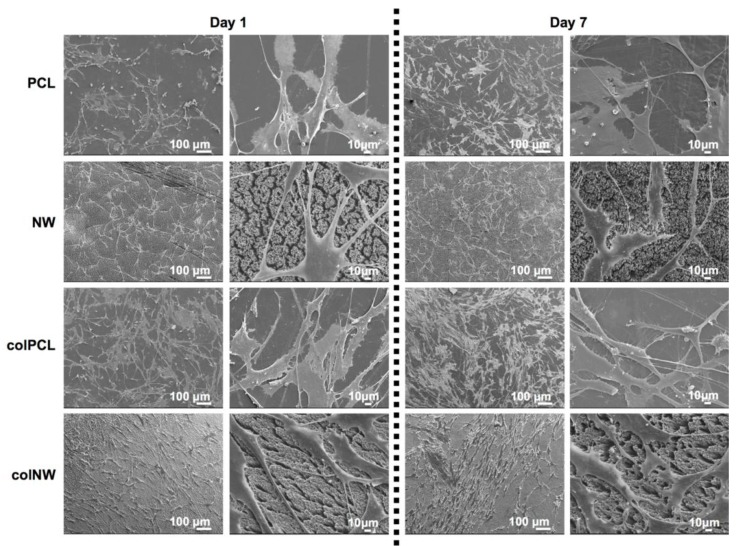
Figure 8.
Representative SEM images of SMCs after one and seven days of culture on different surfaces. Note: the surfaces were coated with a 10-nm layer of gold and imaged at 7 keV. Experiments were replicated on at least three different samples with at least three different cell populations (nmin = 9).

