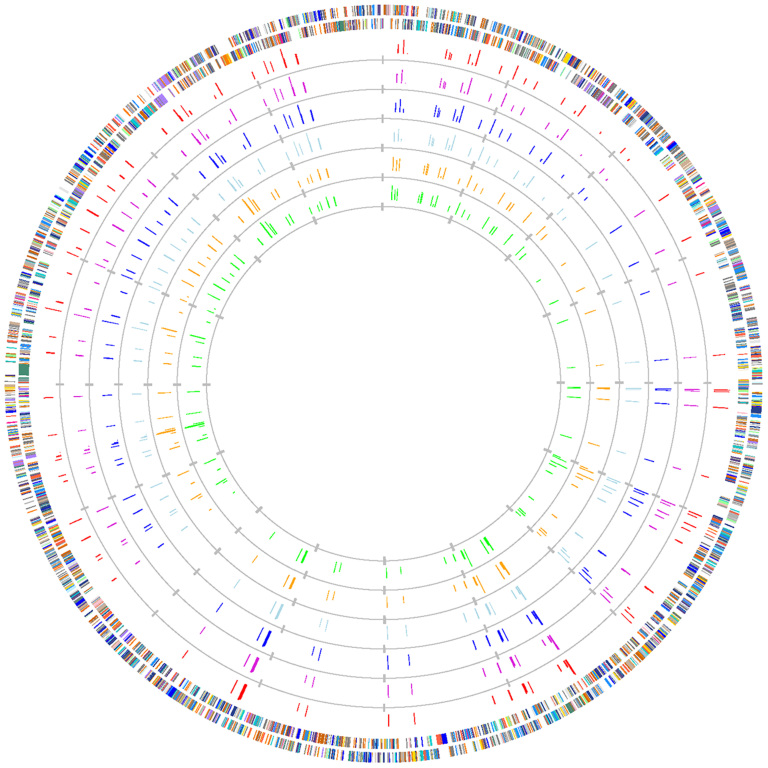
Figure 1. Distribution of differentially expressed genes visualized using GenomeViz software under three conditions of Acidovorax avenae subsp. avenae strain RS-1.
Outmost rings indicate all coding regions in the genomes colored according to COG designation. Red and purple rings correspond to co-culture (1) and (2); blue and light blue rings correspond to in vitro (1) and (2); orange and green rings correspond to in vivo (1) and (2). COG (color): functional designations are described below. J (gold1): translation, ribosomal structure and biogenesis; A (orange3): RNA processing and modification; K (DarkOrange1): transcription; L (DarkOrange3): DNA replication, recombination and repair; B (maroon): Chromatin structure and dynamics; D (AntiqueWhite1): Cell division and chromosome partitioning; Y (yellow): Nuclear structure; V (pink): Defense mechanisms; T (tomato1): Signal transduction mechanisms; M (PeachPuff3): Cell envelope biogenesis, outer membrane; N (MediumPurple1): Cell motility and secretion; Z (red): Cytoskeleton; W (green): Extracellular structures; U (DeepPink): Intracellular trafficking, secretion, and vesicular transport; O (PaleGreen1): Posttranslational modification, protein turnover, chaperones; C (RoyalBlue4): Energy production and conversion; G (Blue1): Carbohydrate transport and metabolism; E (DodgerBlue1): Amino acid transport and metabolism; F (SkyBlue3): Nucleotide transport and metabolism; H (LightBlue1): Coenzyme metabolism; I (Cyan3): Lipid metabolism; P (MediumPurple4): Inorganic ion transport and metabolism; Q (aquamarine4): Secondary metabolites biosynthesis, transport and catabolism; R (gray90): General function prediction only; S (gray70): Function unknown; - (gray50): Not in COGs.

