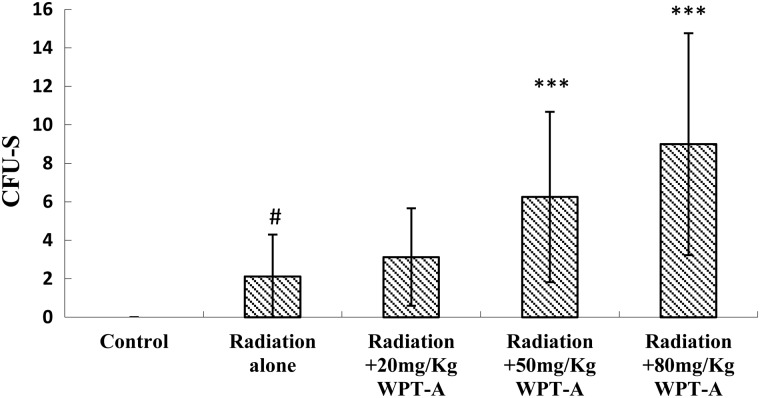
Fig 4.
Effects of pre-irradiation WPT-A on CFU-Ss in mice. In addition, the number of CFU-Ss per spleen was counted. Results are presented as means±SD (n = 24). ***P < 0.001 compared with the radiation-only group. #P < 0.001 compared with the control group. The Student's t-test was used for statistical comparisons between the groups. The P values of different treatment groups were as follows: Radiation and 20 mg/kg WPT-A, 0.1725; Radiation and 50 mg/kg WPT-A, 0.0004; Radiation and 80 mg/kg WPT-A, 1.469 × 10⁻⁵.

