Fig. 2.

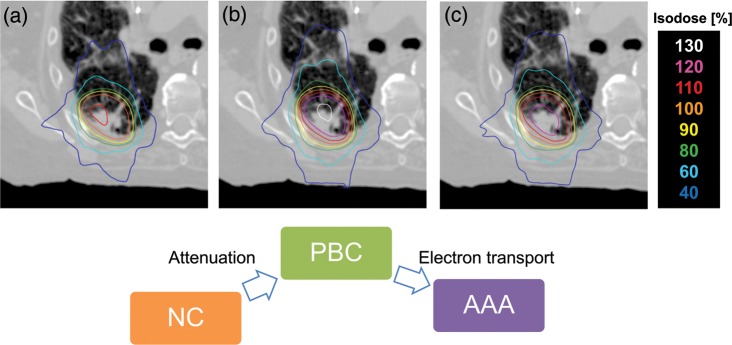
Axial dose distributions of a patient calculated using (a) no heterogeneity correction (NC), heterogeneity correction using (b) PBC with modified Batho, and (c) AAA.

Axial dose distributions of a patient calculated using (a) no heterogeneity correction (NC), heterogeneity correction using (b) PBC with modified Batho, and (c) AAA.