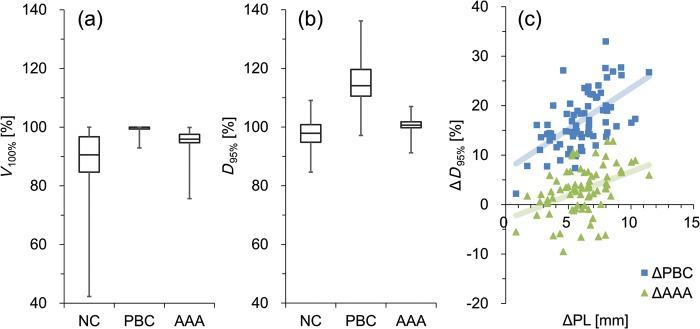
Fig. 4.

(a) The volume receiving the prescribed dose (V100%), and (b) the dose covering the 95% PTV (D95%) calculated without (NC) and with (PBC with modified Batho and AAA) heterogeneity corrections. Boxes represent median and quartile values. Whiskers represent maximum and minimum values. (c) The difference between the D95% calculated without and with heterogeneity corrections (ΔD95%) are illustrated.
