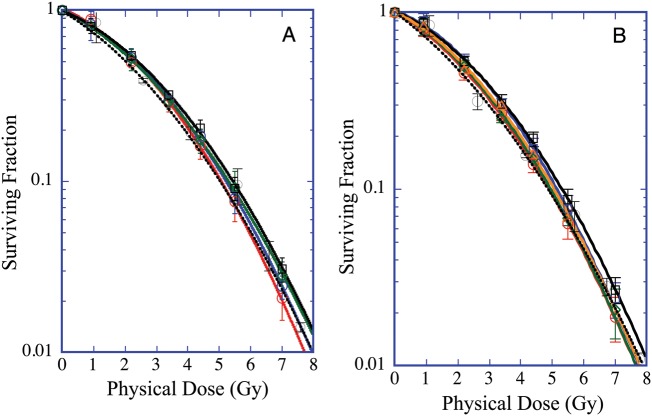
Fig. 1.
Survival curves of HSG cells obtained A) from LINAC high-energy X-ray machines at five different therapy facilities located at the corresponding proton facility, and B) at the middle position of 6-cm SOBP beams at six different proton therapy facilities. The red, blue, green, black, brown and broken lines correspond to each facility A to F, respectively. The symbols and bars are the mean and the standard deviation, respectively, obtained from at least three independent experiments.

