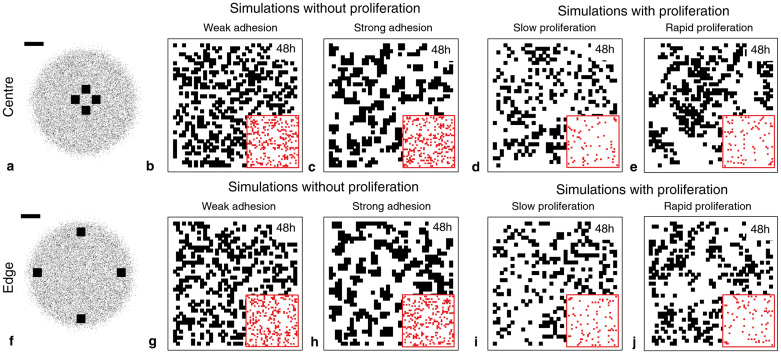
Figure 2. Discrete simulation snapshots with different combinations of cell motility, cell–to–cell adhesion and cell proliferation mechanisms.
The emergence of spatial correlations in a spreading cell population was examined by simulating the biological process using a discrete random walk model with different combinations of adhesion, motility and proliferation. For each simulation we calculated the pair correlation functions in four subregions, each of dimension 600 μm × 600 μm, at the centre of the spreading cell population (a–e) and in four subregions, each of dimension 600 μm × 600 μm, at the edge of the spreading cell population (f–j). The relative size and approximate location of these subregions is shown in (a) and (f), where the scale bar corresponds to 1,500 μm. Simulations are performed on the simulation lattice where the lattice spacing, Δ = 18 μm, corresponds to the average diameter of the nucleus. Results in (b–c) and (g–h) correspond to simulations at t = 0 hours where 30% of simulation lattice sites are initially occupied with simulated cells, uniformly at random. While results (d–e) and (i–j) are initially occupied at 5%. The initial distribution of simulated cells, for each simulation, is shown as an inset in red. The size of the inset is approximately 550 μm × 550 μm. Simulation snapshots with no proliferation and weak adhesion (q = 0.3) are shown in (b) and (g) and snapshots with no proliferation and strong adhesion (q = 0.7) in (c) and (h). All results with no proliferation include unbiased motility where D = PmΔ2/4τ = 248 μm2/hour. Snapshots in (d) and (i) illustrate simulations with no adhesion and slow proliferation (td = 23 hours). While results with no adhesion and rapid proliferation (td = 12 hours) are shown in (e) and (j). Results with proliferation are simulated using D = 248 μm2/hour for td = 23 hours and D = 23 μm2/hour for results with td = 12 hours. Results in row 1 and 2 correspond to pair correlation signals computed at the centre and at the edge of the cell population, respectively.

